This collection of tools and resources aims to assist those working to advance environmental justice.
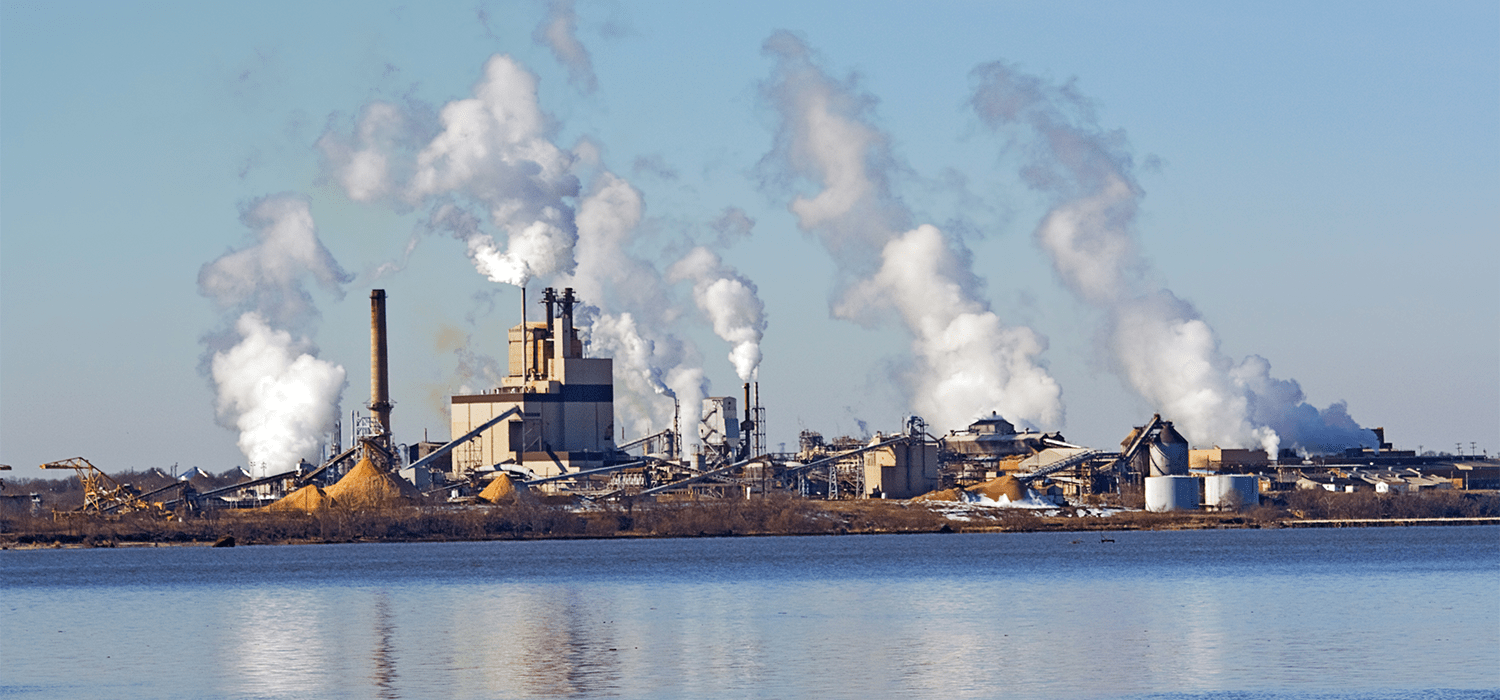
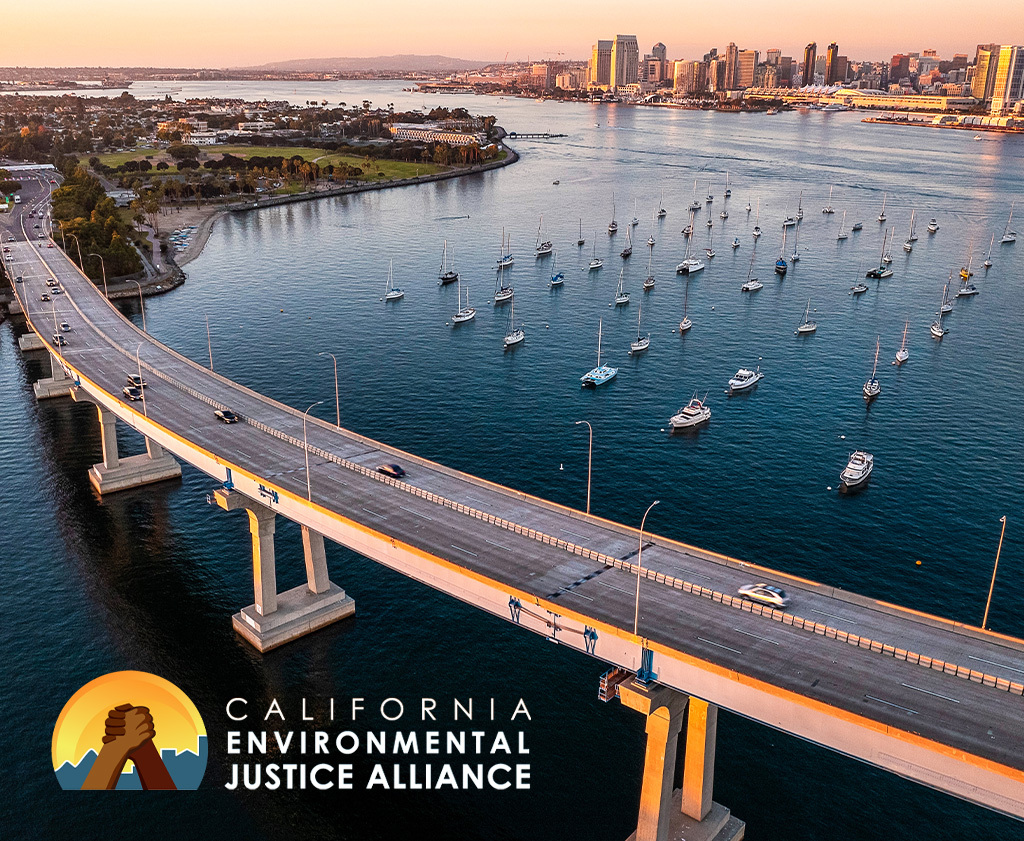
The California Environmental Justice Alliance (CEJA) Environmental Justice Scorecard serves as a leading model for evaluating environmental justice legislation. The first CEJA Scorecard was developed in 2013. The most recent one, the 2024 edition, celebrated key wins, including AB 421 (referendum reform) and AB 1167 (responsible oil-well transitions), showcasing the power of cross-sector advocacy. However, progress was hindered by industry interference, with bills like AB 1000—meant to protect communities from large warehouses near sensitive sites—stalling early. While 2023 saw the introduction of bold, precedent-setting environmental justice bills, many failed to reach a floor vote due to intense lobbying. CEJA remains committed to advancing stronger environmental justice legislation in 2025.

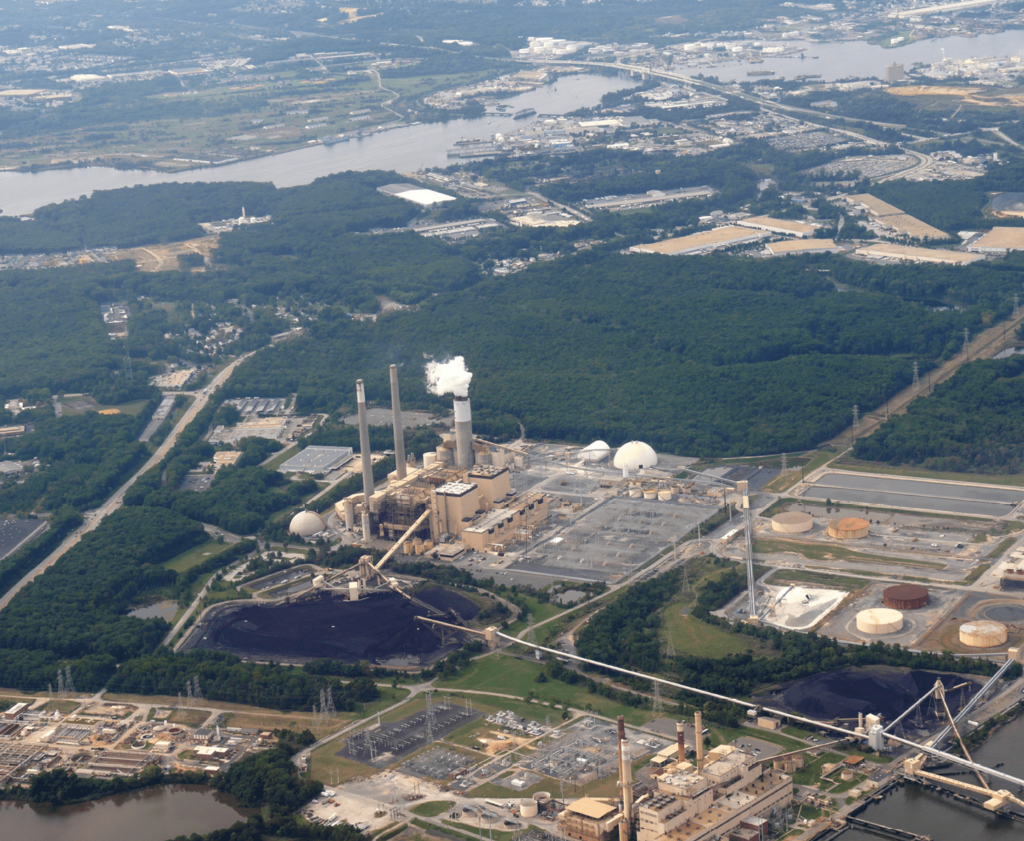
The Maryland EJ Scorecard series was first developed in 2019. The Agency Scorecard rated nine agencies from 0 through 5 across five areas, including environmental justice office establishment, environmental protection, focus on impacted communities, environmental literacy efforts, and proactive environmental justice work. From 2019 to 2024, the top-performing agencies were the Departments of Environment and Natural Resources, while the Department of Housing showed the greatest need for improvement. The team plans to expand the scorecard to other states in the Mid-Atlantic, updating it every two years.
This scorecard tracks the Maryland General Assembly’s (MGA) (141 delegates and 47 senators) voting histories on environmental justice legislation. A thorough search of the MGA archives for environmental justice-related legislation from 2019 to 2024 was conducted. Appropriate bills were placed into priority tiers, ranked to promote inter-rater reliability, and legislator scores were generated accordingly as a weighted percentile rank. Overall, this scorecard provides a tool to educate residents about the voting record on environmental justice bills, and organizations can use the tool to both challenge elected officials for change in areas where environmental justice is overlooked and applaud legislators who have been environmental justice advocates.

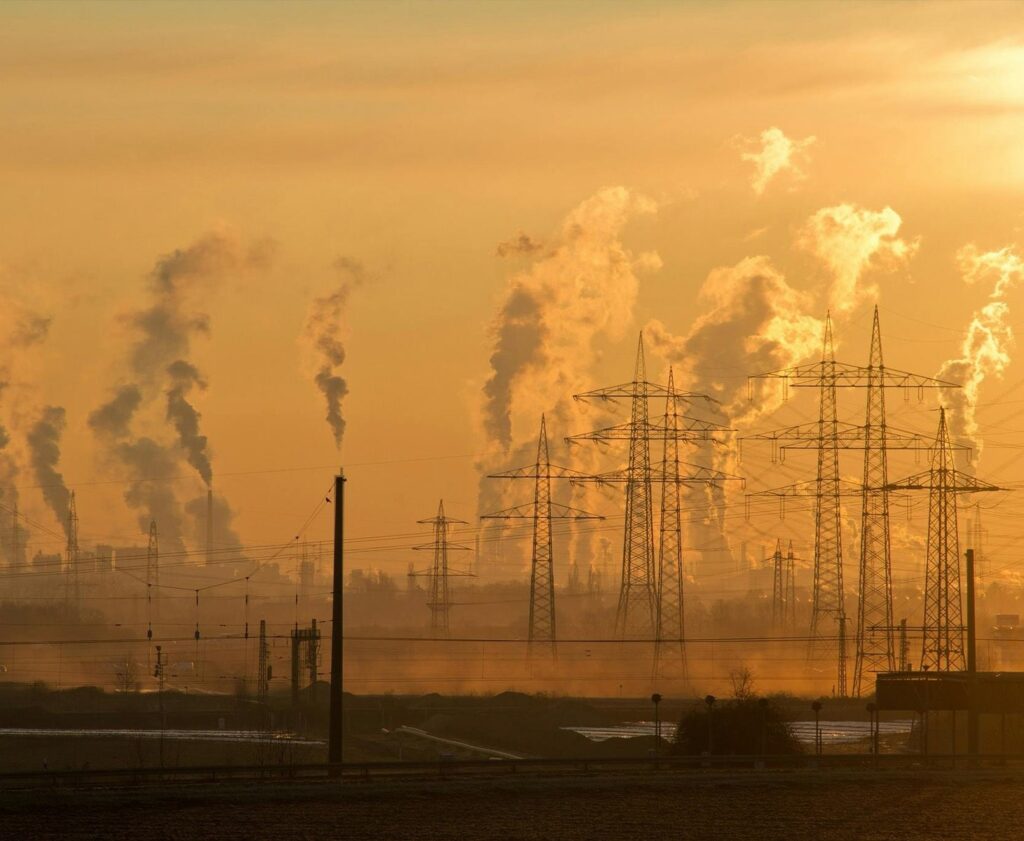
Across the nation, community science trainings have been used to equip residents impacted by air pollution and extreme heat with the skills to use low-cost air sensors to collect meaningful data on their exposures in order to address environmental injustices. While the Trump Administration has dismantled EJ funding, many projects are still ongoing with the support and resilience of local stakeholders. Below are examples of such projects around the nation:
Across the nation, community science trainings have been used to equip residents impacted by air pollution and extreme heat with the skills to use low-cost air sensors to collect meaningful data on their exposures in order to address environmental injustices. While the Trump Administration has dismantled environmental justice funding, many projects are still going with the support and resilience of local stakeholders. Below are examples of such projects around the nation:


This tool was created by the Center for Environmental Justice with support from the Bezos Earth Fund. The Bullard Center worked with a team of Historically Black Colleges and Universities-based environmental justice scholars to visualize how neighborhood factors of race and ethnicity intersect with the White House Council on Environmental Quality’s Justice40 Disadvantaged Community designation, which does not include those factors by design. By integrating data sets on air quality, toxic facilities, climate risks, and social determinants of health, the tool enables users—especially grassroots organizations, researchers, and policymakers—to advocate for targeted interventions. It also serves as an accountability mechanism to ensure federal and state policies reach those most impacted by environmental and climate justice issues.
The Centers for Disease Control and Prevention (CDC) is a national public health institute in the United States focused on protecting public health and safety through the control and prevention of disease, injury, and disability.
The Environmental Justice Index (EJI) is the first national place-based tool designed to measure the cumulative impacts of environmental burden through the lens of human health and health equity. The EJI delivers a single rank for each community to identify and map areas most at risk for the health impacts of environmental burden. The 2024 iteration of the EJI includes several updates based on feedback received through community engagement mechanisms, including the addition of a Climate Burden Module and an EJI + Climate Burden rank that integrates data on climate risks, environmental hazards, socioeconomic inequality, and population health.

Pulling in 184 sets of data to rank more than 70,000 U.S. Census tracts, the Climate Vulnerability Index (CVI) integrates climate data, pollution exposure, public health metrics, and socioeconomic factors to help policymakers, advocates, and community leaders prioritize resources and interventions where they are needed most. Feedback from community partners at each stage of CVI development ensured the tool included data reflecting their lived experiences, which is crucial for advocacy efforts and helps define where programs and policies can best meet existing needs and promote stronger, more resilient neighborhoods.
The California Office of Environmental Health Hazard Assessment (OEHHA) released a draft CalEnviroScreen 4.0 for public comment from February to May 2021. OEHHA convened a webinar and six workshops on the draft CalEnviroScreen 4.0 for the public to learn about the updates and provide public comment on the draft. Feedback was integrated into the current live version of the tool. Users can filter CalEnviroScreen 4.0 data by geography (county, city, or legislative district) and by any combination of the results from the 21 CalEnviroScreen indicators.

Duis aute irure dolor in reprehenderit in voluptate velit esse cillum dolore eu fugiat nulla pariatur.
Duis aute irure dolor in reprehenderit in voluptate velit esse cillum dolore eu fugiat nulla pariatur.
Duis aute irure dolor in reprehenderit in voluptate velit esse cillum dolore eu fugiat nulla pariatur.
Duis aute irure dolor in reprehenderit in voluptate velit esse cillum dolore eu fugiat nulla pariatur.
Duis aute irure dolor in reprehenderit in voluptate velit esse cillum dolore eu fugiat nulla pariatur.
Duis aute irure dolor in reprehenderit in voluptate velit esse cillum dolore eu fugiat nulla pariatur.